Visual Tools for Systems Insight
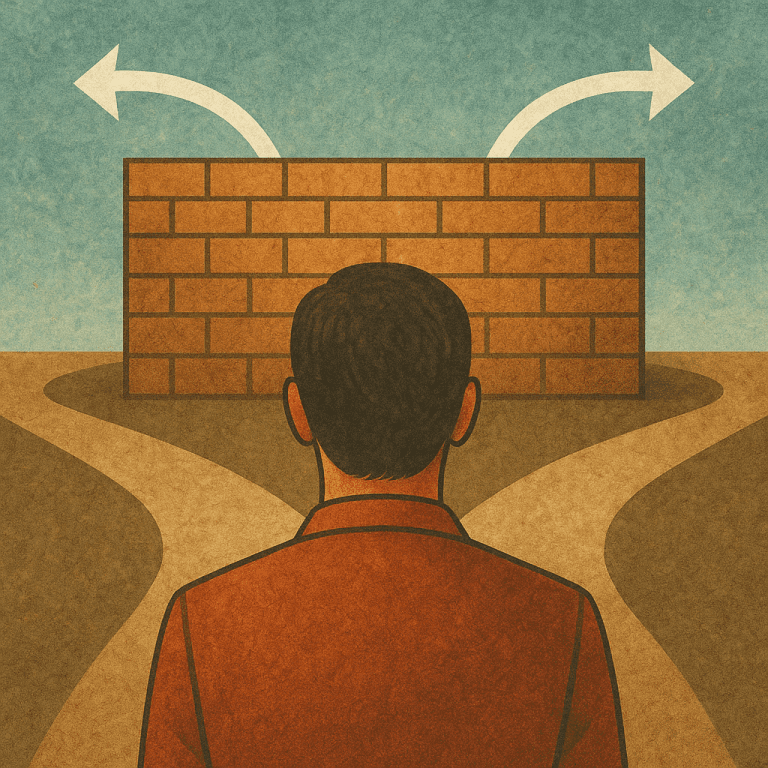
In the face of complex systems, words often fail us.
We talk. We theorize. We write extensive reports. Yet, even after all that effort, it can still feel like we’re trying to hold fog in our hands — the true dynamics remain elusive.
That’s because systems aren’t linear stories with a beginning and an end. They’re dynamic patterns of cause, feedback, flow, and adaptation. And to truly see those intricate patterns, sometimes the best move isn’t to say more or write more.
It’s to draw.
Not as art.
As insight.
🧭 Why Draw?
The Power of Externalizing Your Thinking
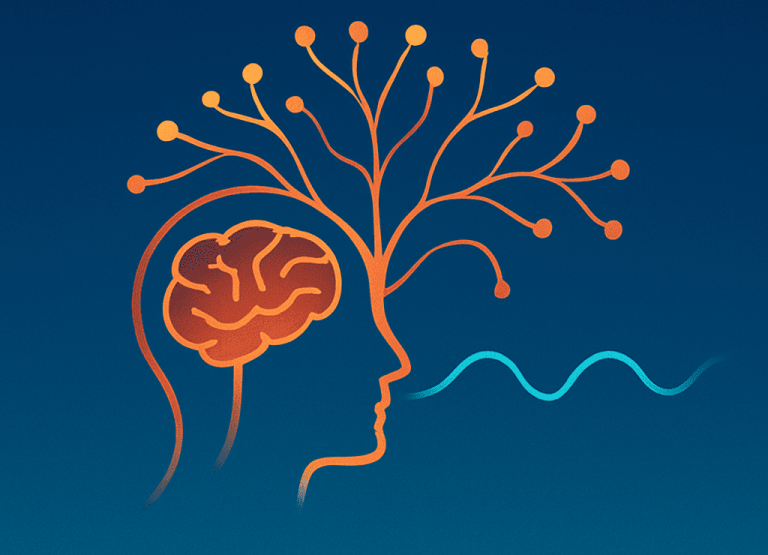
In systems thinking, drawing isn’t mere decoration or an afterthought. It’s a way of knowing.
When we sketch or diagram a system, we externalize our mental models. We slow down automatic assumptions. We reveal hidden loops, time delays, interdependencies, and tipping points — elements that are usually buried deep in our subconscious thinking.
Drawing helps us:
- Make the intangible visible.
- Surface shared understanding (or expose hidden disagreement).
- Identify key leverage points for change.
- Engage others in collaborative inquiry.
You don’t need to master every visual tool. Just start. Even a messy napkin sketch can spark a level of clarity a polished slide deck can’t.
Let’s explore five powerful visual tools that help bring complex systems to life.
🔁 1. Causal Loop Diagrams (CLDs)
Mapping feedback and flow
CLDs show how different variables influence one another in feedback loops. They’re the backbone of systems thinking diagrams.
There are two types of loops:
- Reinforcing Loops (R) – amplify change.
E.g., “The more confident I feel → the better I perform → which boosts confidence.” - Balancing Loops (B) – stabilize change.
E.g., “The hotter I get → the more I sweat → which cools me down.”
Use CLDs when you’re trying to understand why a system behaves the way it does — especially when stuck patterns or runaway growth cycles are present.
Consulting Tip: If your client says, “We keep doing X, and Y keeps happening,” draw it together. You’ll often uncover invisible feedback loops that sustain the status quo.
⛲ 2. Stock & Flow Diagrams
Seeing accumulations and movement
CLDs show relationships. Stock & Flow diagrams show quantities over time.
- Stocks are things that accumulate (e.g., cash, skills, backlog, morale).
- Flows are the rates that increase or decrease them (e.g., hiring, resignations, investments).
Example:
Stock: Employee expertise
Inflows: Training, mentoring
Outflows: Turnover, burnout
These diagrams reveal why small changes in flows can create massive changes over time.
Consulting Insight: When things feel “stuck” despite effort, map the stocks and flows. You may discover hidden depletion or bottlenecks nobody’s watching.
📈 3. Behavior Over Time Graphs (BOTGs)
Patterns before events
BOTGs are simple sketches of how one or more variables change over time — no precise data required.
You might chart:
- Customer satisfaction over two years.
- Morale across a project lifecycle.
- Trust in leadership after a crisis.
This tool focuses attention on trends, not isolated events.
Use it to ask:
- “Where are we headed?”
- “What patterns are repeating?”
- “What shifted the curve?”
Pro Tip: Have multiple people draw their own BOTG for the same issue. Differences in their lines reveal differences in mental models — and open rich dialogue.
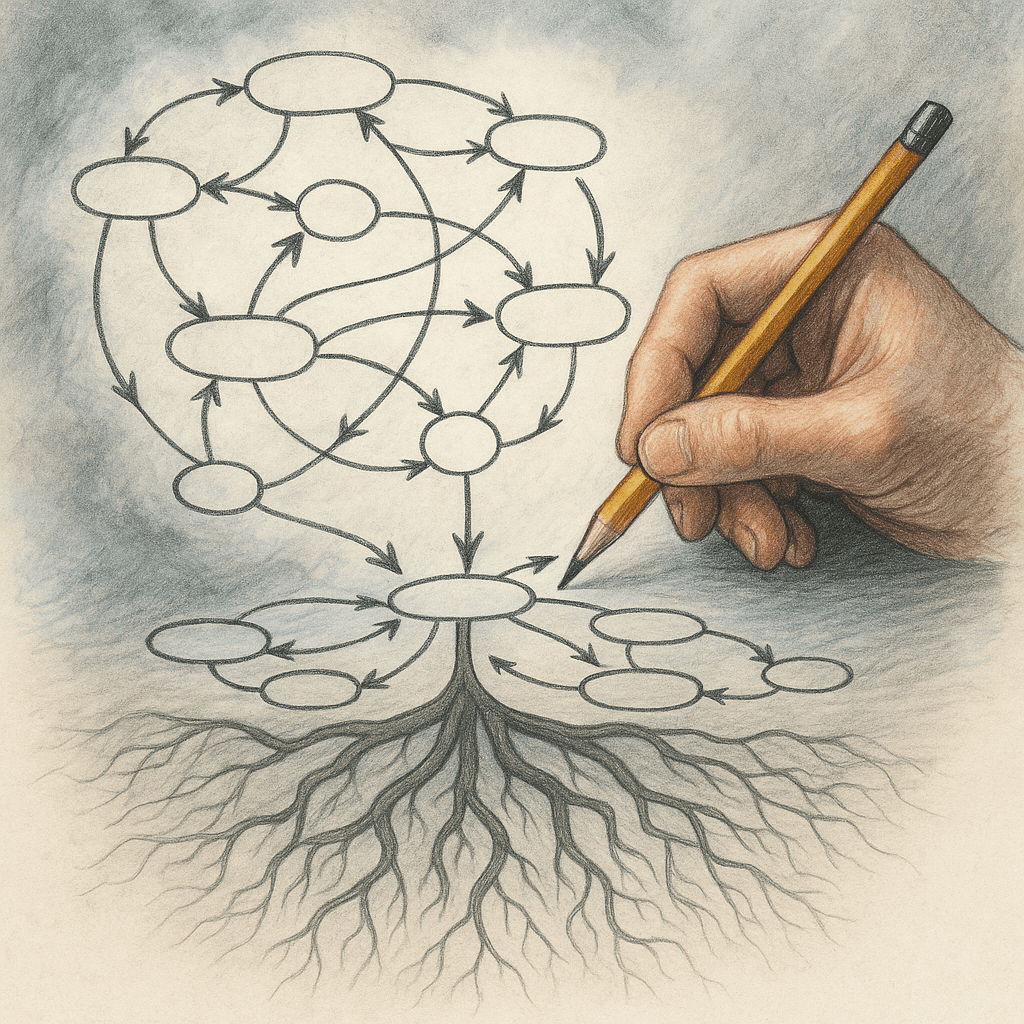
🌀 4. Connection Circles
From tangle to pattern
When a problem feels like a spaghetti mess of interrelated factors, start with a Connection Circle.
Here’s how:
- Write key variables in a circle.
- Draw arrows between them where influence exists (+ for positive, – for negative).
- Step back and look for loops, bottlenecks, and leverage points.
It’s raw, interactive, and often reveals emergent patterns fast.
Use when:
- Stakeholders are overwhelmed.
- You’re early in exploring the system.
- You want to co-create clarity across diverse perspectives.
🎨 5. Rich Pictures
A whole-system sketch in one messy image
Rich Pictures are freeform visual stories of a system — with people, emotions, relationships, politics, tensions, and power dynamics all in the same space.
They include:
- Stakeholders (drawn or symbolized)
- Emotions (storm clouds, sunshine, stress bubbles)
- Organizational flows
- Cultural dynamics
- External influences
There are no rules. It’s about capturing the felt complexity in all its messy reality.
Consultant Wisdom: Co-create a Rich Picture with your client. The act of drawing together uncovers alignment, misunderstandings, and deep insight — often faster than any workshop or slide deck.
💬 Real Talk: Why Drawing Systems Matters
We draw not because we’re artists —
We draw because we’re systems explorers.
These tools help us:
✅ Slow down linear thinking
✅ Make the invisible visible
✅ Surface assumptions
✅ Engage stakeholders
✅ Reveal leverage points
✅ Transform overwhelm into structure
They’re bridges — from confusion to clarity.
From abstraction to actionable insight.
From lone analysis to shared understanding.
And you don’t need fancy software.
Just a marker. A notebook. A willingness to sketch what others struggle to explain.
🛠 Mini-Practice: Draw One Loop or Picture
Pick a challenge — in your life, your work, or with a client.
Now pick one visual tool:
- 🔁 Use a CLD if the issue involves cycles or stuck patterns.
- ⛲ Try a Stock & Flow Diagram if resources are rising/falling.
- 📈 Sketch a BOTG if you’re curious about trends over time.
- 🌀 Use a Connection Circle if there are too many moving parts.
- 🎨 Try a Rich Picture if the system feels emotional, political, or cultural.
Don’t aim for a masterpiece.
Aim to see differently.
Then ask:
What did I just make visible… that was hidden a moment ago?
🧠 Final Thought
In complexity, clarity doesn’t always come through more data or deeper analysis.
Sometimes it comes through a drawing.
Systems thinkers don’t just think better.
They see differently.
And often, they draw their way into insight.
Because sometimes, the most powerful consulting move you can make…
…is to sketch what everyone else is still trying to explain.
- The Whisper of the Whole: A Systems Thinking Guide for Consultants
- What is a System, Really?
- The Living Dance of Systems
- Resilience and the Wisdom of Adaptive Systems
- Roots of Insight
- The Systems Thinker’s Compass
- Drawing Complexity
- Peering Below the Surface
- Master Methodologies in Systems Thinking
- Enhancing Familiar Tools with Systems Thinking
- Transforming Business Through Systems Thinking
- Systems Thinking in Public Policy & Governance
- Sustainable Systems
- Systems Thinking for Engineering & Technology
- The Inner System: You
- The Roadblocks
- The Future of Systems Thinking
- Systems Thinking FAQ: Myths, Misunderstandings & Core Insights